Dashboard
What each card and panel on the dashboard shows, how the numbers are counted, and what to do when the dashboard is empty.
What the dashboard is
The dashboard is the first page you see after signing in, and a read-only summary of everything EyalSec has recorded on your account. Open it any time from Dashboard at the top of the left sidebar.
It changes nothing: to look at individual events, open Events; to change what is detected, use Configure or Filters.
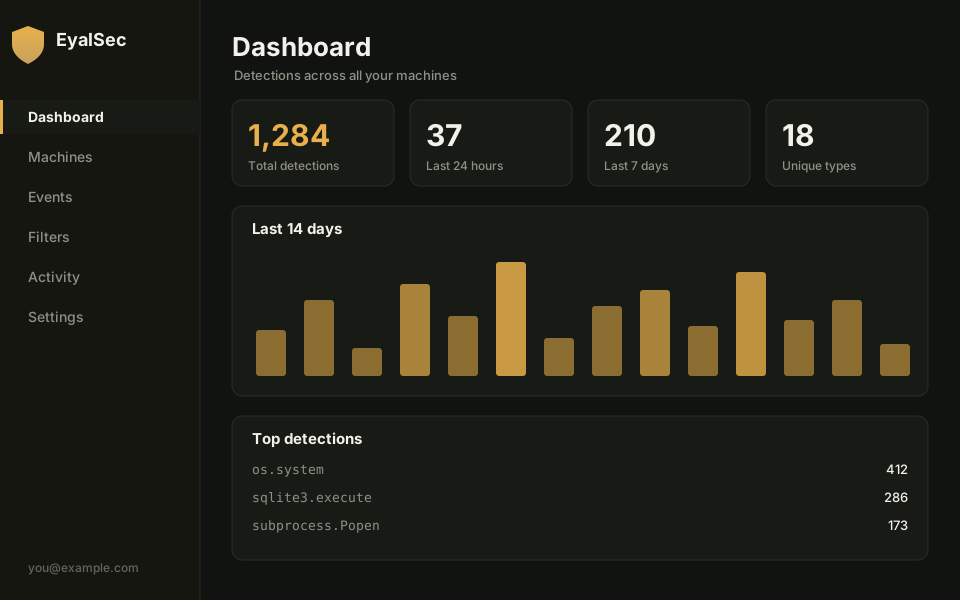
Cards and panels
The dashboard is made of four number cards along the top, a 14-day chart, and four panels below it. Every figure covers your whole account: all machines and all products together, including suppressed events.
Counts are detections: each time an event happens counts once, so an event that repeated 40 times adds 40, the same number as its count on the Events page.
Total Detections
Total Detections (subtitle all time hits) is how many detections have been recorded on your account, across every machine and product, since your first event. Deleting a machine removes its events from this total.
Unique Event Types
Unique Event Types (subtitle distinct event names) is how many different kinds of event you have seen, counted by the place each event happened: its sink label, such as os.system or sqlite3.execute. Many events of the same kind count once.
Last 24 h and Last 7 d
Last 24 h and Last 7 d count the detections in events first recorded in the last 24 hours and the last 7 days. They tell you at a glance whether something new is happening right now.
These windows go by when each event was first recorded. A repeat of an event first seen a month ago adds to Total Detections and to that event's count, but not to Last 24 h, so a jump here means new kinds of events rather than more of the old ones.
Detections: last 14 days
Detections: last 14 days is a bar chart with one bar per day for the last two weeks, oldest on the left. Hover over a bar to see the date and the number. Days are calendar days in UTC, and like the cards above, each event's detections are placed on the day it was first recorded.
Top Events by Count
Top Events by Count lists the ten event types (sink labels) with the most detections, highest first, with a bar showing each one against the top entry. It shows where most of your noise, or most of your risk, is coming from.
Recent Activity
Recent Activity lists the ten events that were first recorded most recently, newest first. An old event that keeps repeating does not come back to the top of this list. Each line shows when the event was first recorded (in your display time zone), its sink label and its count so far, as ×12.
This panel is about detected events. What you did on your account (sign-ins, machine changes) is in the Activity log.
Event Type Breakdown
Event Type Breakdown shows how the top eight event types split between them, each with a colored bar and a percentage. The percentages are shares of those eight together, not of all your detections, so they always add up to about 100% even when you have many more types.
Stats at a Glance
Stats at a Glance collects the headline numbers in one list:
| Row | What it shows |
|---|---|
| First detection | the date of your earliest recorded event |
| Latest detection | the date of your most recently recorded event |
| Avg detections / day | all-time detections divided by the days between the first and latest detection |
| Last 1 h | detections in events first recorded in the last hour |
| Last 24 h | the same for the last 24 hours |
| Last 7 d | the same for the last 7 days |
| Total all-time hits | the same number as Total Detections |
A dash (-) means there are no events yet.
When the numbers update
The dashboard reads its numbers once, when the page loads; it does not refresh on its own. The time next to the Dashboard title (updated 14:03:22) is when that happened. Reload the page for newer figures.
The numbers themselves can be up to about 30 seconds behind the newest events. If the page cannot reach the server, it shows "Failed to load events".
Add your first machine
Until your account has a machine, the dashboard starts with a box titled Add your first machine to start detecting. Add a machine takes you to the Machines page, and Read the quick start opens the Quick start.
The box goes away once you have added a machine.
Empty dashboard
A dashboard full of zeros and "No data" means no events have been recorded yet. The usual reasons are that the machine is not installed yet, that no taint source is switched on (every source is off until you turn it on), or that your program is not running under the EyalSec product.
Check that the machine shows installed on the Machines page, switch sources on in Configure, and see No events for more.